

Once Grigora's AI editor builds your website, thoroughly reviewing it before going live ensures your layout looks stunning and functions seamlessly on all devices. Grigora provides multiple dedicated preview tools—including real-time interactive canvas testing, multi-device viewport switching, fullscreen mode, and standalone browser previews. This guide covers every way to inspect and review your built website.
1. Interacting with the Real-Time Preview Canvas
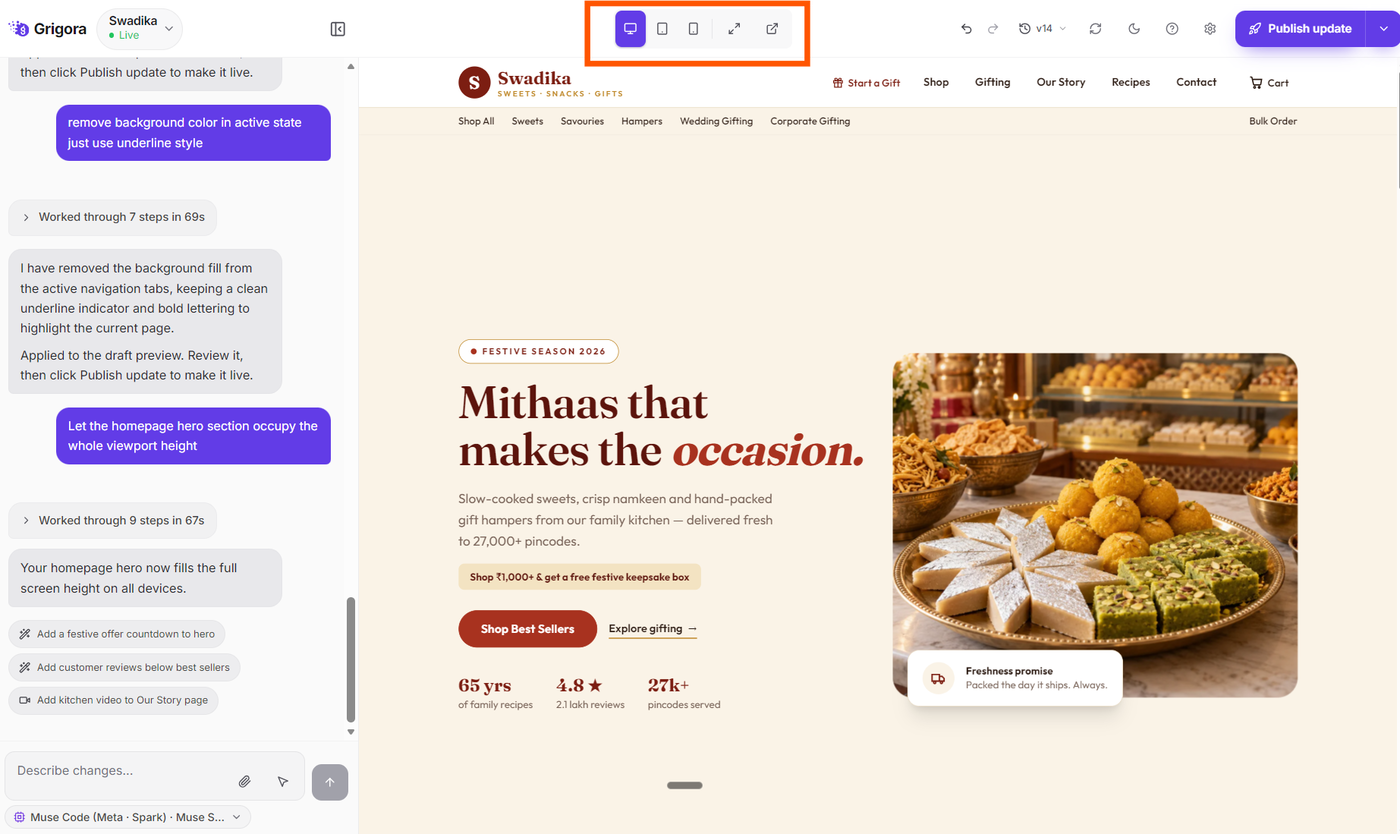
The large preview canvas on the right side of your workspace is not a static screenshot; it is a fully rendered, interactive live website:
Clickable Links & Navigation: Click navigation links in your header or footer to browse between pages (such as Home, About, or Contact) directly inside the canvas.
Testing Forms & Inputs: Type into contact forms, toggle FAQ accordions, and interact with buttons to verify their layout and response.
Live Updates: Whenever you send a prompt in the AI chat, the canvas updates in real time to reflect the changes immediately.
2. Testing Across Responsive Viewports
In the center of the top navigation bar, the viewport switcher lets you test how your website adapts across screen sizes with a single click:
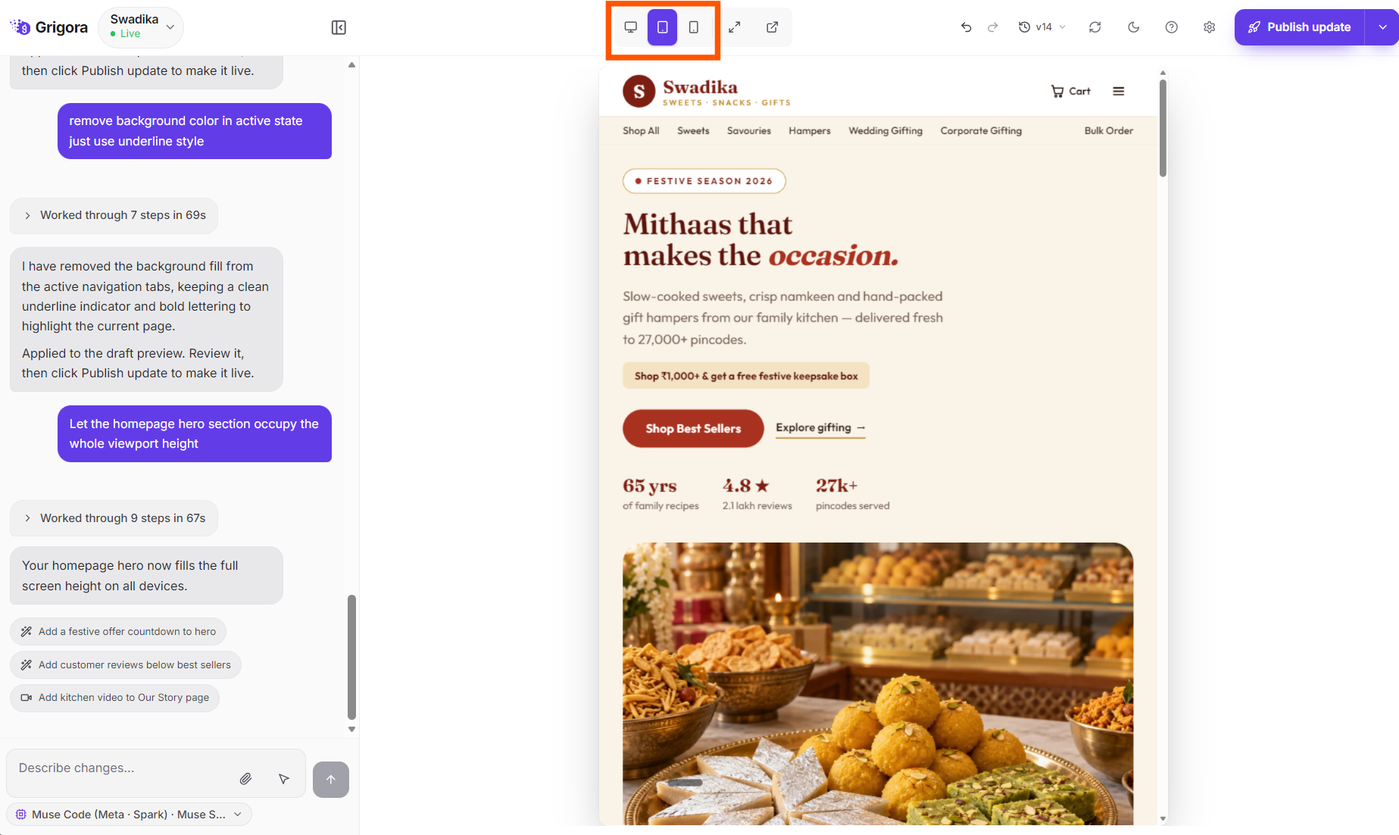
Desktop View (Monitor Icon): Displays your website at standard widescreen desktop dimensions. Use this mode to evaluate multi-column grids, wide hero banners, and expansive navigation menus.
Tablet View (Tablet Icon): Resizes the canvas to medium tablet dimensions. Ideal for verifying that multi-column layouts stack gracefully and that card spacing remains balanced.
Phone View (Smartphone Icon): Compresses the canvas into a mobile screen frame. Use this mode to inspect mobile navigation menus, button touch targets, font readability, and vertical scrolling flow.
3. Fullscreen Review Mode
To inspect your design without interface distractions:
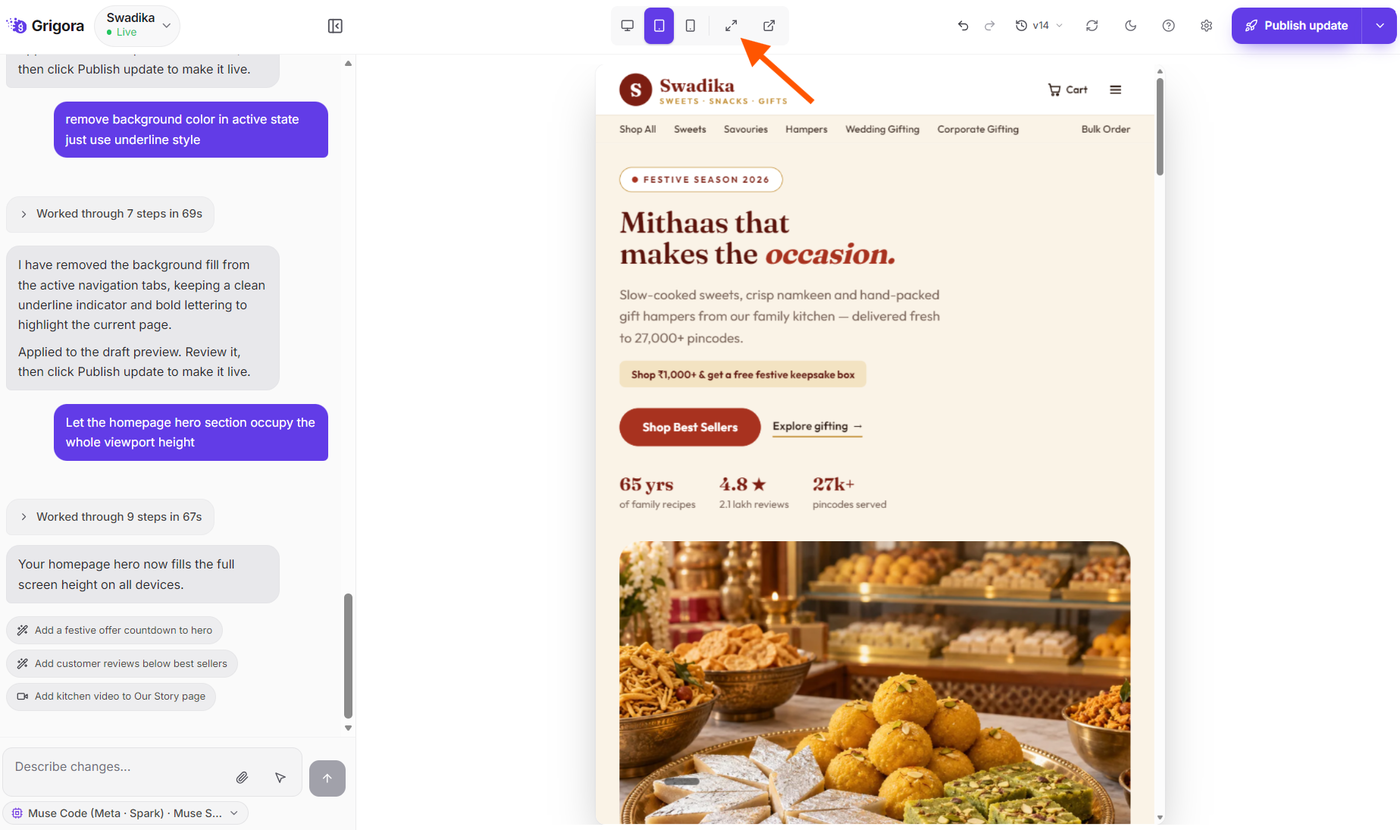
Click the Fullscreen button (expand arrows icon) located in the top navigation bar beside the viewport switcher.
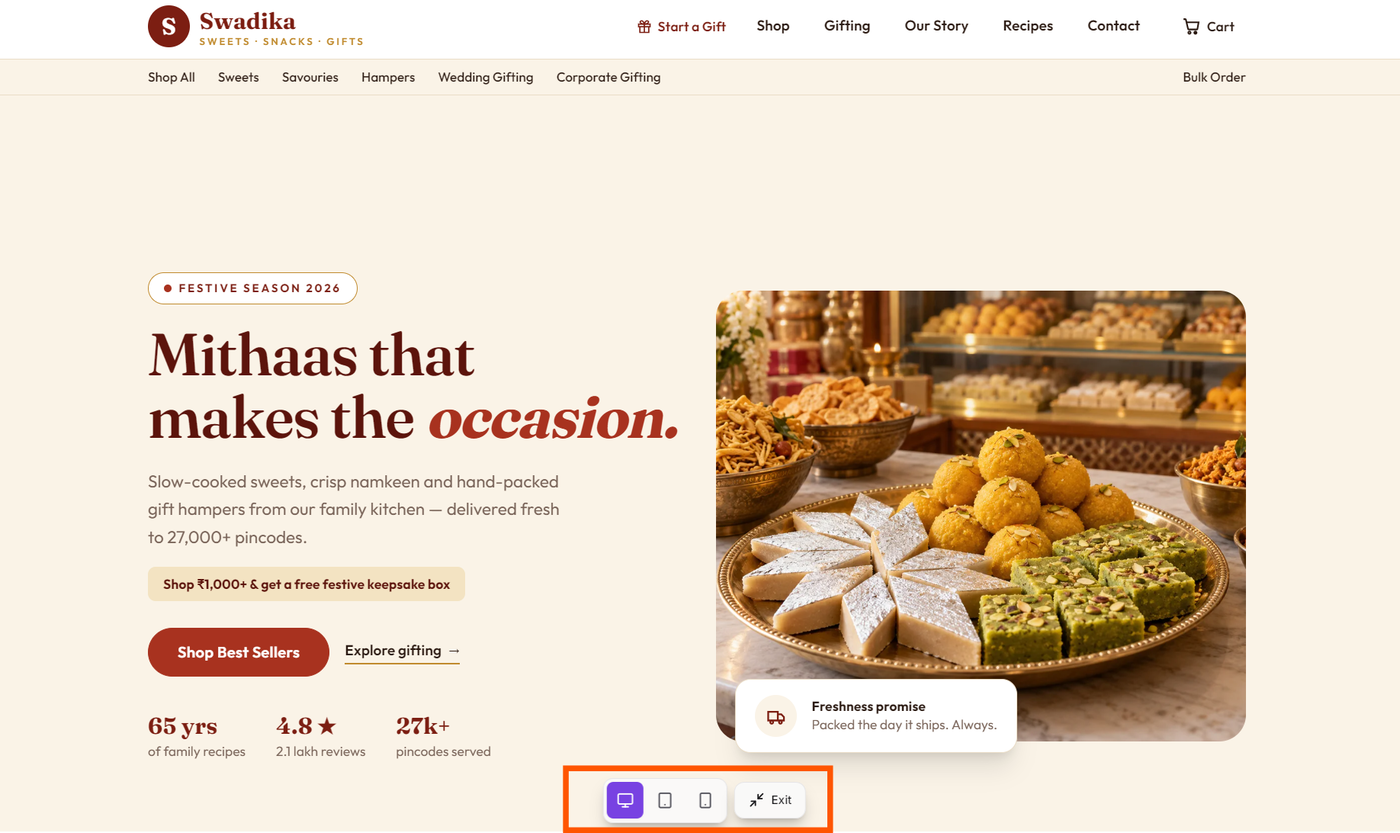
The preview canvas expands to fill your entire monitor screen, hiding sidebars and toolbar controls.
Click the button again (or press Escape) to return to the standard editor workspace.
4. Opening in a Standalone Browser Tab
For the most accurate real-world testing:
Click the Open in new tab button (external link icon) in the topbar.
Your website preview launches in a new, independent browser window.
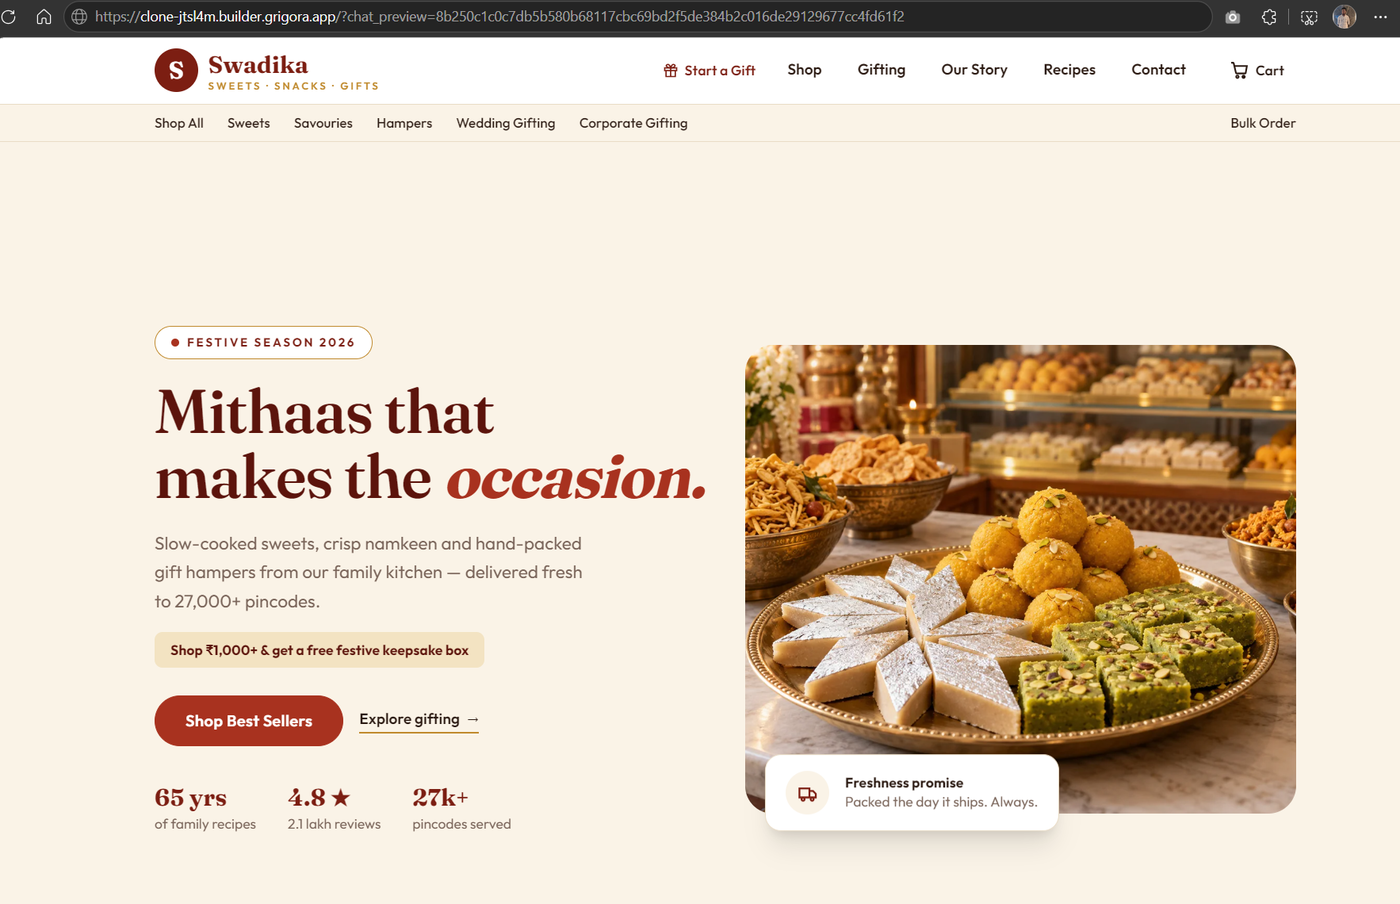
Why Use This: Testing in a separate tab lets you see exactly how visitors will experience your site in full browser viewports, outside the editor frame. It also allows you to test browser back/forward buttons, URL changes, and full window resizing.
5. Refreshing the Preview Canvas
If you ever want to re-render the preview canvas from scratch:
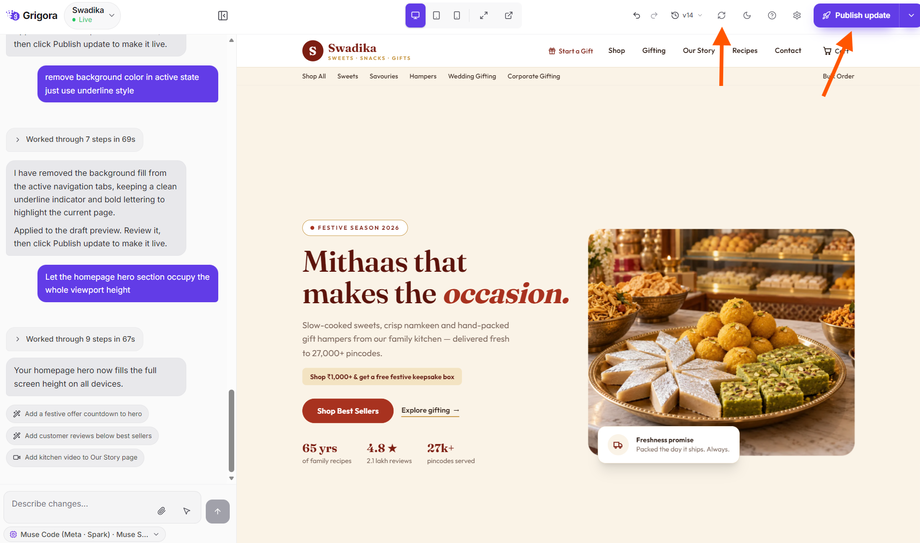
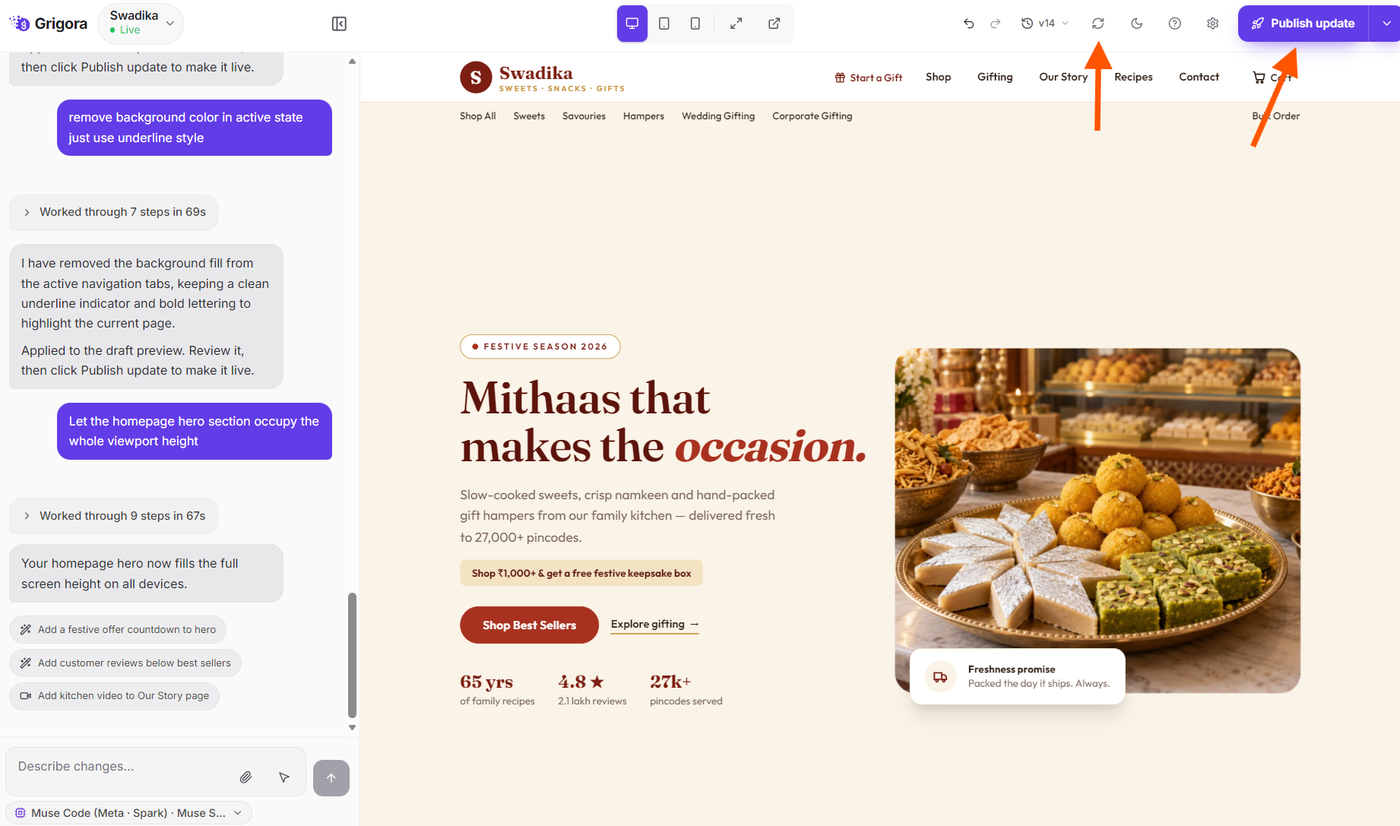
Click the Refresh preview button (circular arrow icon) in the topbar.
The canvas reloads immediately, ensuring all scripts, stylesheets, and newly generated assets are fresh.
6. Checking Website Draft vs. Live Status
In the top-left corner of the editor, the website name pill displays a real-time status indicator:
Gray Dot (Draft): Indicates that recent changes are saved in your workspace but have not yet been published to your live domain.
Green Dot (Live): Indicates that your site has been published and visitors can see the current version live on the web.
When you are satisfied with all your reviews, click the purple Publish button (rocket icon) in the top-right corner to push your changes live.
Next Steps
Continue exploring the AI website builder with these related guides:
AI Website Editor Walkthrough: Interface Controls & Tools Explained — Overview of every toolbar button and control in the workspace.
How to Manage Website Versions in Grigora — Learn how to preview historical versions, track changes, and restore earlier snapshots.
How to Create a Website Using the AI Website Editor — Step-by-step instructions for launching your first AI-built website.