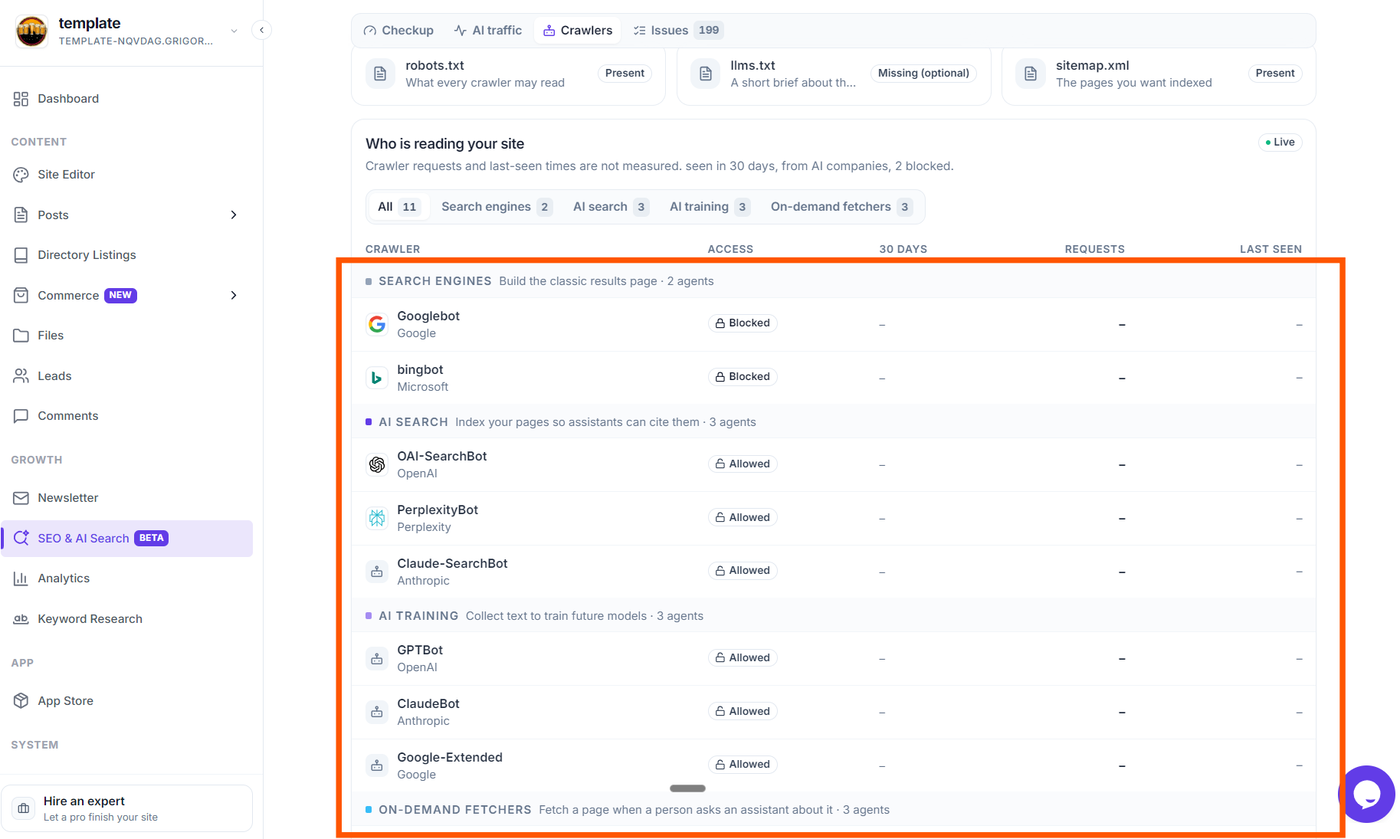
While standard website analytics in Grigora tracks human sessions, bounce rates, and device types, the SEO & AI Search dashboard provides dedicated tracking for visitors referred directly by conversational AI assistants and automated search bots reading your content.
By monitoring AI traffic and crawler activity, you can see how frequently platforms like ChatGPT, Perplexity, and Google Gemini cite your website, identify which pages receive the most AI-driven traffic, and verify that web crawlers have proper access to index your site.
Accessing AI Traffic and Crawler Reports
To view your AI analytics:
From your Grigora dashboard, click SEO & AI Search under the Growth section in the left sidebar.
Use the top navigation tabs to switch between AI traffic (referrals from conversational AI engines) and Crawlers (indexing bots and discovery files).
Note: General website analytics (overall pageviews, geographic locations, and visitor durations) remains under the Analytics tab in your main sidebar. AI traffic and crawler tracking focus specifically on generative engine discovery and bot inspection.
Tracking Visitors from AI Assistants
The AI traffic tab tracks visitors who clicked a citation link inside an AI assistant and landed on your website over the last 30 days.
Key Summary Metrics
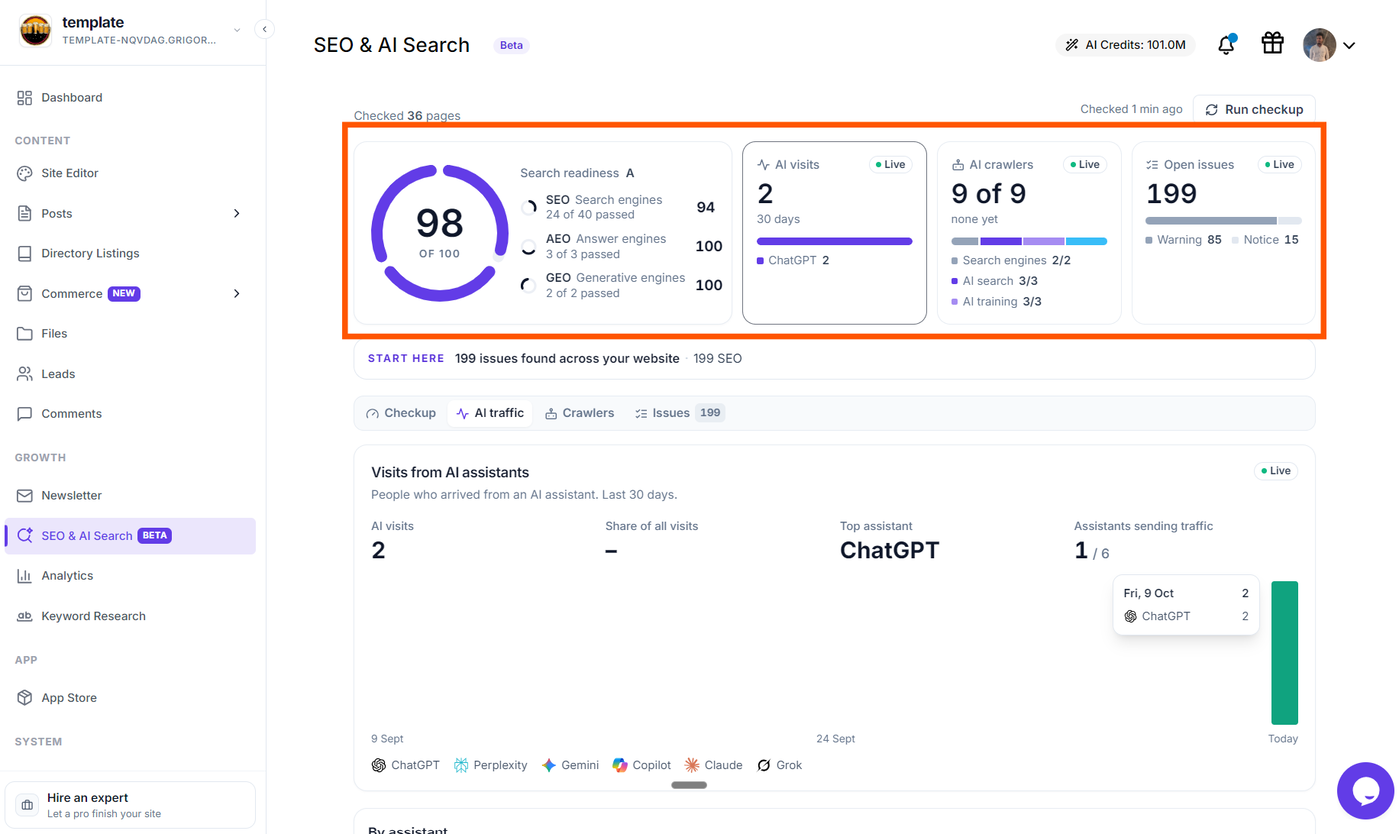
At the top of the Visits from AI assistants card, key metrics summarize your AI referral performance:
AI visits: Total visitor sessions originating from AI assistants over the past 30 days.
Share of all visits: The percentage of your website's total traffic driven by AI assistants.
Top assistant: The specific AI platform that generated the highest volume of visits to your website (e.g., ChatGPT or Perplexity).
Assistants sending traffic: The number of active AI platforms referring traffic out of the six supported platforms (e.g., 1 / 6).
Supported AI Platforms
Grigora tracks referrals across six major generative engines:
ChatGPT (OpenAI · chatgpt.com)
Perplexity (Perplexity AI · perplexity.ai)
Gemini (Google · gemini.google.com)
Copilot (Microsoft · copilot.microsoft.com)
Claude (Anthropic · claude.ai)
Grok (xAI · grok.com)
Reading the 30-Day Referral Chart
Below the summary numbers, an interactive 30-day timeline chart displays daily visit volumes:
Each bar represents one day, with segments illustrating traffic volume across the date range.
A color-coded legend at the bottom maps each AI platform to its respective color indicator.
Hovering over any date bar reveals the exact date and visit count for that day.
Drilling Down by Assistant
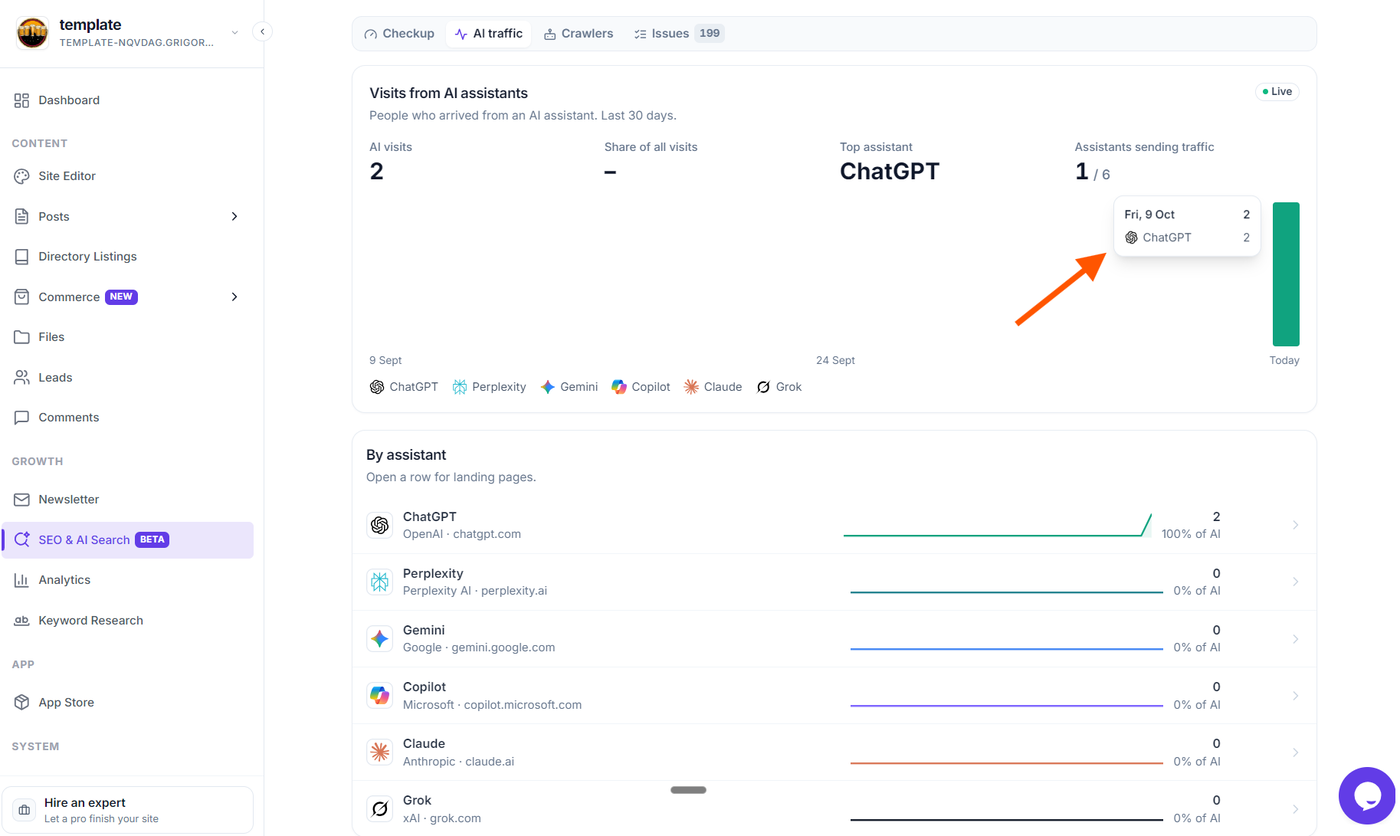
The By assistant section breaks down traffic across each generative engine:
Each row displays the assistant's icon, operator, host domain, a 30-day activity sparkline trend, total visit count, and percentage share of your total AI traffic.
Expanding an Assistant Row: Click any assistant row (or the arrow on the right) to reveal granular landing page details, including the specific pages or blog posts visitors landed on and individual visit counts.
Inspecting Crawler and Bot Activity
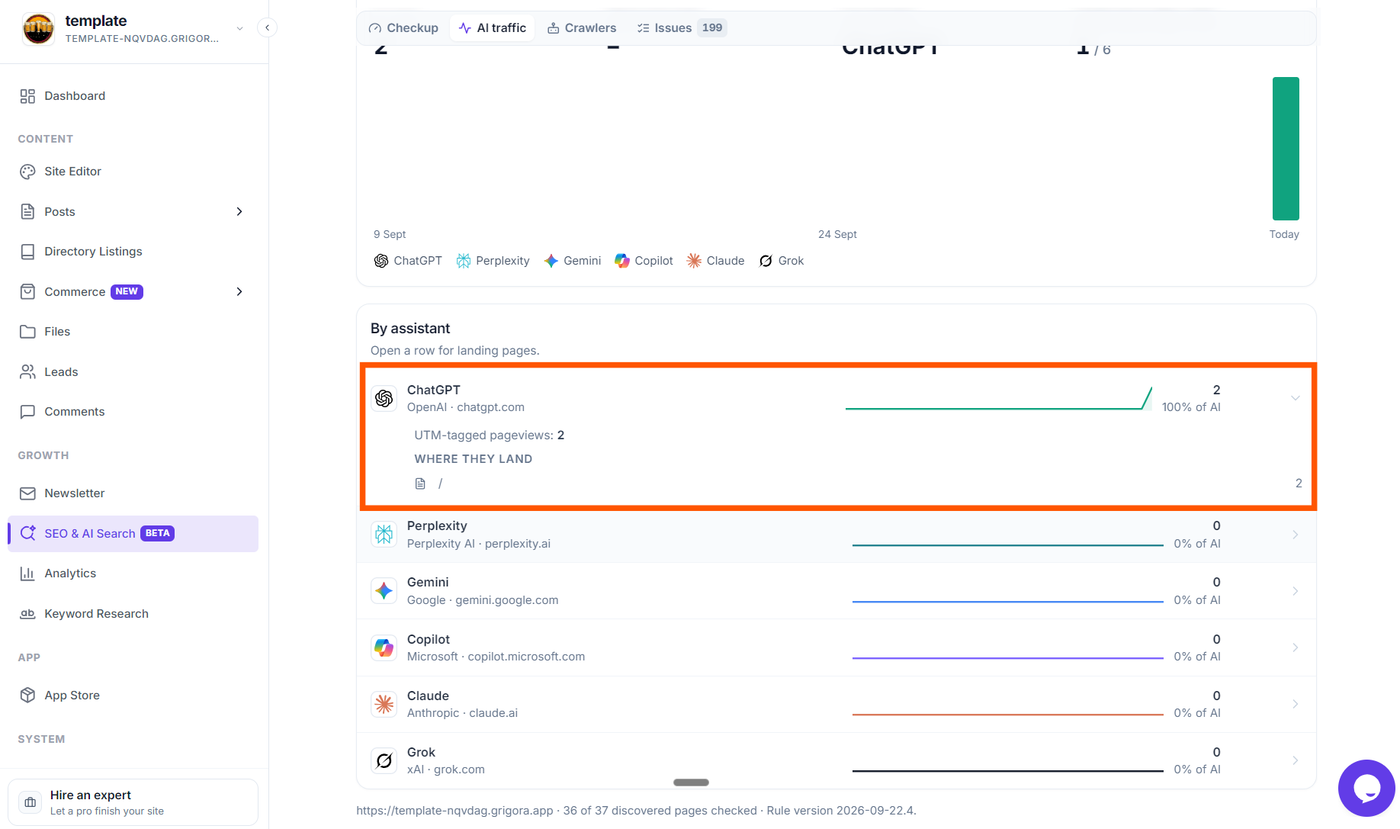
The Crawlers tab reveals which search engines, indexing bots, and AI training crawlers are visiting your website, and whether your site permits or blocks them.
Key Discovery Files
The top of the Crawlers tab checks three critical discovery files hosted on your domain:
robots.txt: Defines crawling rules for search bots. Displays whether the file is Present, Missing, or Unavailable. Clicking the card opens your live
robots.txtfile in a new browser tab.llms.txt: An emerging standard providing a clean brief of your site for AI assistants. Displays whether the file is Present or Missing (optional). If missing, a Fix with AI button is available to generate one for you.
sitemap.xml: Guides search engines to published pages. Shows whether the sitemap is active. Clicking the card opens your live XML sitemap in a new tab.
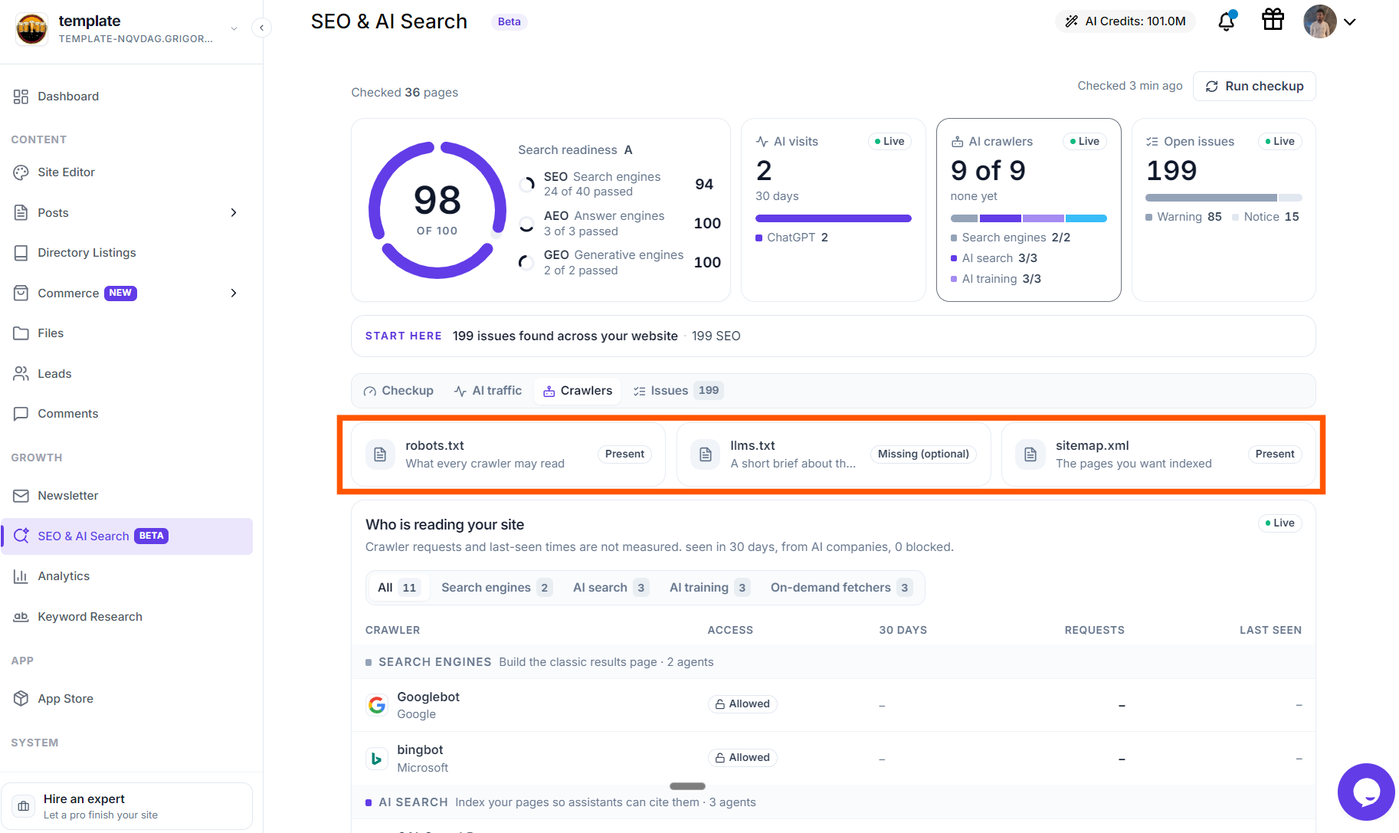
The "Who is reading your site" Table
This table tracks bot permissions and requests. You can use the segmented filter buttons at the top of the table to view All crawlers or filter by specific functional categories:
Search engines: Classic indexing bots such as Googlebot and bingbot.
AI search: Real-time search indexers used by assistants to cite fresh content, such as OAI-SearchBot (OpenAI), PerplexityBot, and Claude-SearchBot (Anthropic).
AI training: Bots gathering web content for model training, such as GPTBot, ClaudeBot, and Google-Extended.
On-demand fetchers: Bots that fetch a specific webpage when a user asks an assistant about a shared link.
Table Columns and Permissions
For each bot, the table displays:
Crawler: The bot name, operator, and platform icon.
Access: A neutral badge pill displaying the crawler's permission status according to your
robots.txtfile:Allowed: Displays an outlined badge with an unlock icon indicating the crawler is permitted to index your pages.
Blocked: Displays an outlined badge with a lock icon indicating the crawler is restricted by your directives.
Partial: Displays an outlined badge indicating specific paths are allowed while others are restricted.
Unknown: Displays an outlined badge when no explicit directive is defined.
Hovering over the access badge reveals the exact matching directive and line number in your
robots.txtfile.30 days: A mini sparkline trend representing activity over the past month (or an en-dash when requests are not measured).
Requests: The total recorded crawler hits over the period (or an en-dash when unmeasured).
Last seen: A relative timestamp showing when the crawler last visited your site (or an en-dash when unmeasured).