

Sending a newsletter is only half the job; understanding how your subscribers engage with your emails provides the insights needed to improve future campaigns. Grigora provides an intuitive, comprehensive Campaign Report dashboard that maps your email’s journey from dispatch to final click.
This guide explains how to access campaign reports, interpret the delivery funnel, and evaluate core engagement metrics.
Accessing a Campaign Report
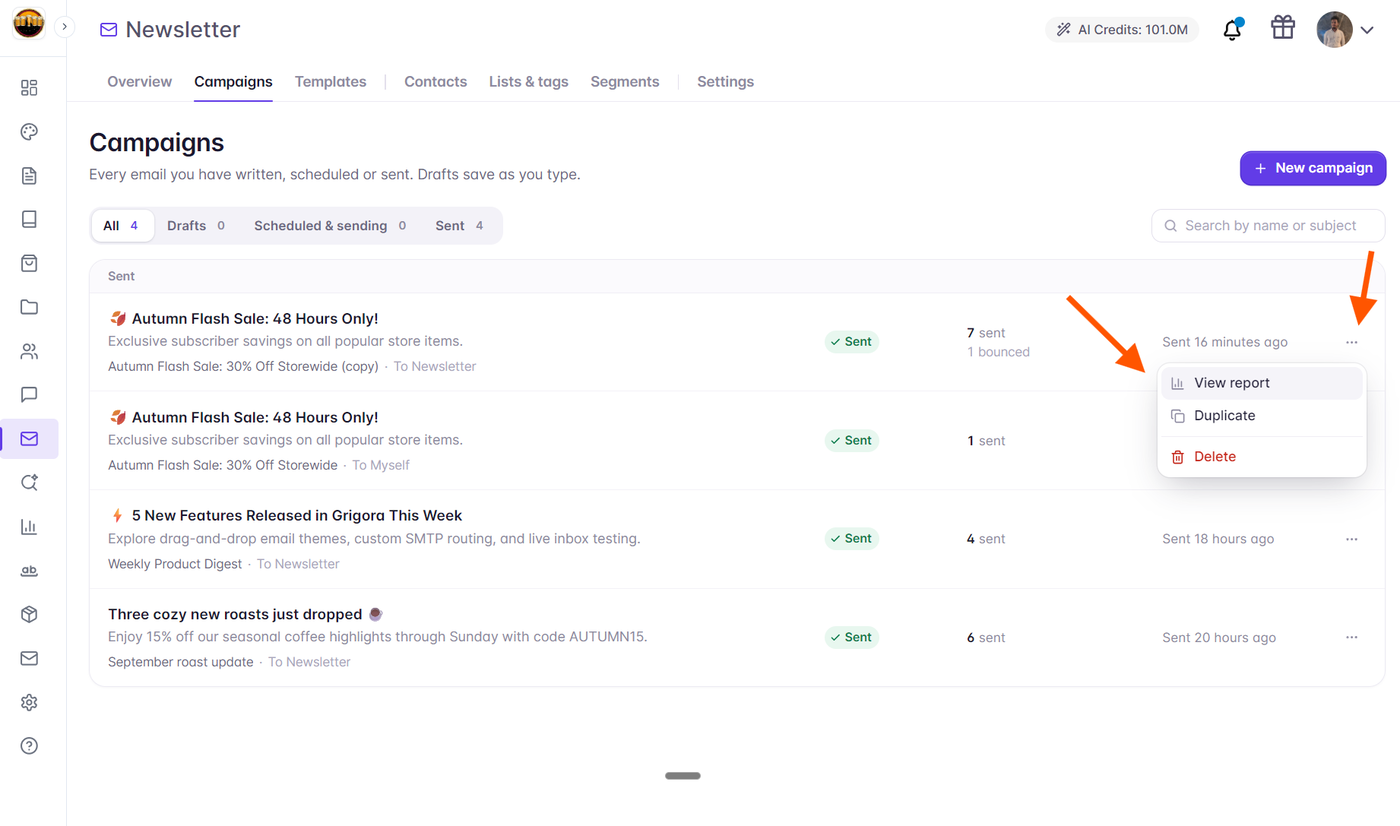
Navigate to Newsletter → Campaigns from your left sidebar.
Locate any campaign with the status
Sent,Sending,Paused, orCancelled.Click directly on the campaign name or select View report from the three-dots action menu.
Grigora will open the dedicated reporting view for that specific campaign.
The Email Journey Funnel
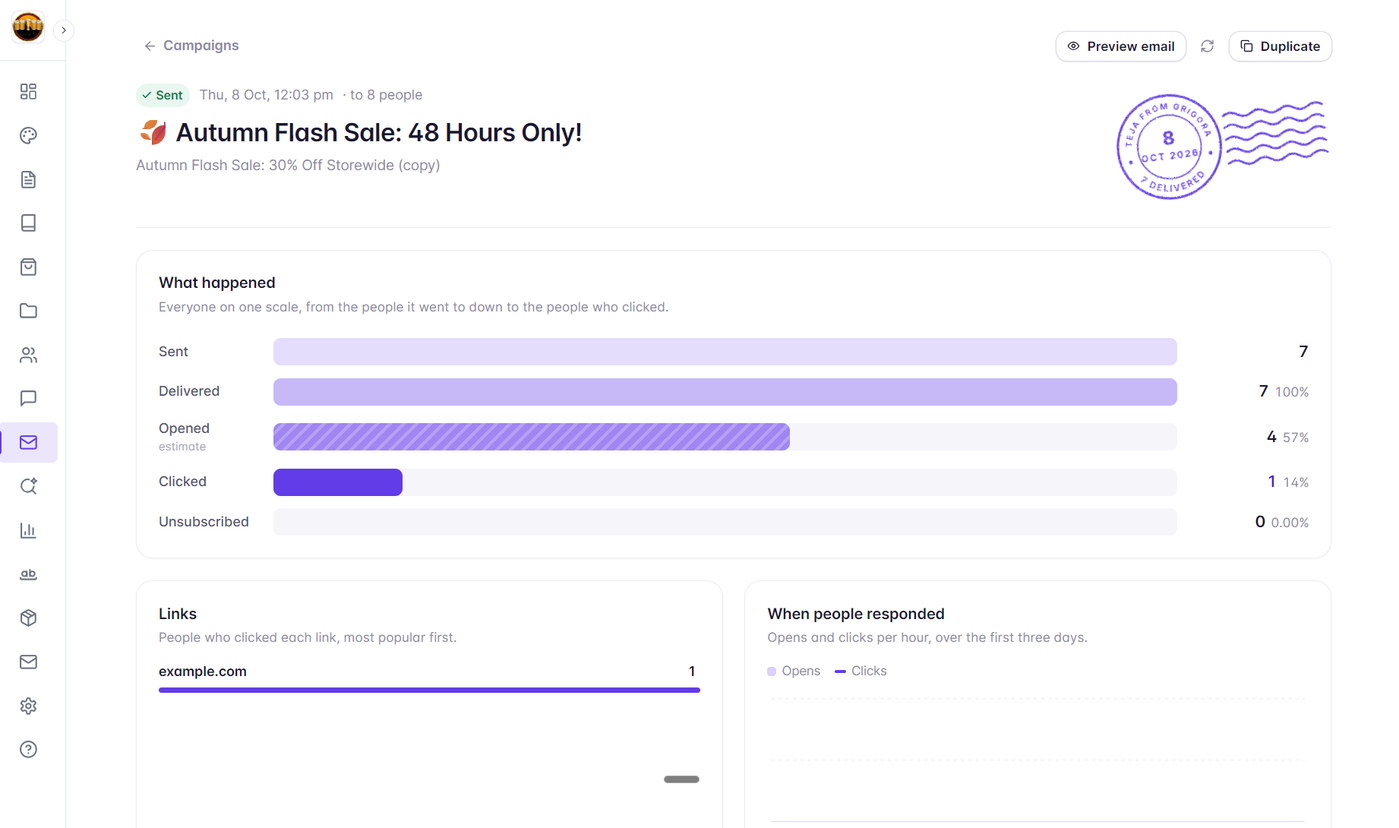
At the top of the report, Grigora presents a unified delivery funnel displayed on a shared scale, allowing you to visualize drop-off across each stage:
Total Recipients: The total number of subscribers targeted by your audience inclusion rules.
Sent: Total messages dispatched through your SMTP server or delivery provider.
Delivered: Emails successfully accepted by recipients' mailbox servers (calculated as Sent minus Bounces).
Opened: The number of subscribers who opened and viewed the email.
Clicked: The number of unique recipients who clicked at least one link inside the email.
Understanding Open Rates and the "Opens are an Estimate" Notice
In your Grigora report, you will notice that open rates are labeled as an estimate:
Why Opens are an Estimate: Email opens are traditionally tracked via a transparent 1x1 tracking pixel. However, modern email privacy protections (such as Apple Mail Privacy Protection and enterprise security scanners) frequently pre-fetch and load images automatically in background caches. Conversely, subscribers who block image loading may read an email without triggering the tracking pixel. For this reason, Grigora clearly marks opens as estimates and recommends focusing on Click Rates as the most reliable indicator of real reader engagement.
Key Engagement Metrics Defined
Delivery Rate (%): Percentage of sent emails that successfully reached recipient inboxes without bouncing. Aim for 98% or higher.
Open Rate (%): Percentage of delivered recipients who opened the email. Typical industry benchmarks range between 20% and 35%.
Click Rate (%): Percentage of delivered recipients who clicked a link.
Click-to-Open Rate (CTOR): Ratio of unique clickers relative to open estimates, measuring how compelling your content was to those who read it.
Bounce Rate (%): Percentage of dispatches rejected by receiving mail servers (target under 2%).
Unsubscribe Rate (%): Percentage of readers who opted out via this campaign (healthy lists remain under 0.3%).
Real-Time Polling for In-Flight Campaigns
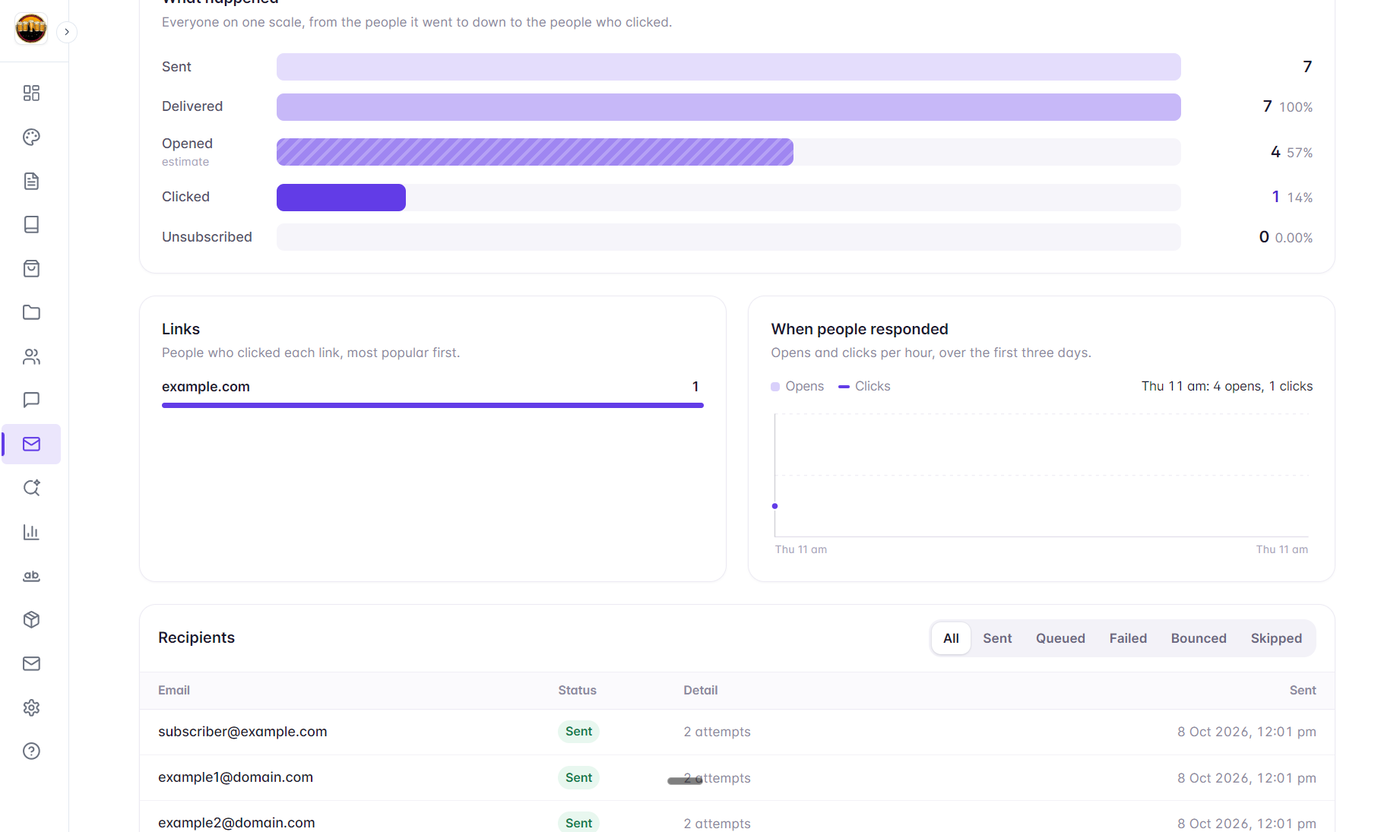
If you view a campaign report while the campaign status is Sending, Grigora automatically polls for new delivery events every 4 seconds. The progress bar updates live as emails are delivered, opened, and clicked.