

Grigora provides built-in analytics to help you monitor your website performance directly from the dashboard. You can view traffic, visitors, page performance, locations, devices, and commerce metrics without connecting an external analytics service.
If you have connected Google Analytics, you can also switch to Google Analytics from the Analytics page.
Accessing Analytics
Step 1: Open Analytics
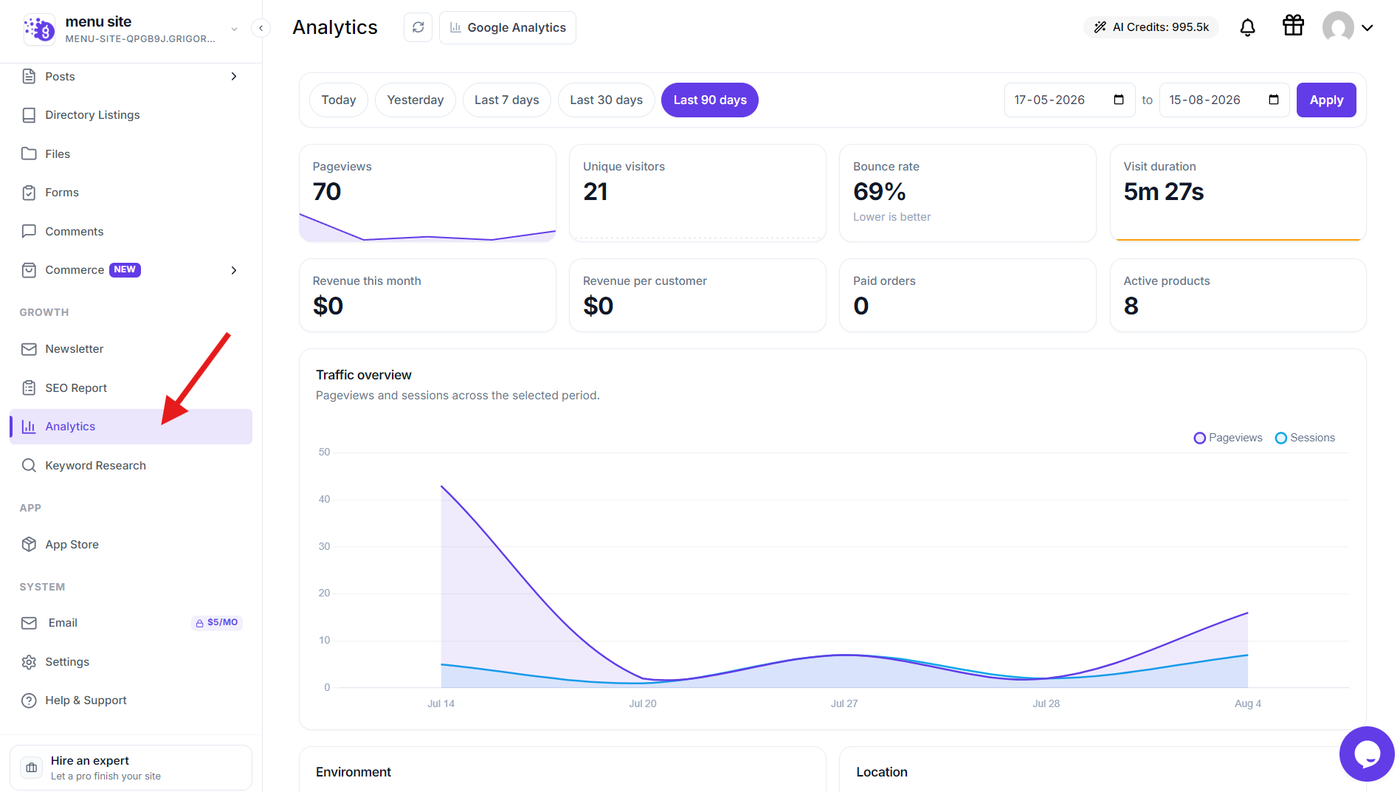
From your Grigora dashboard, click Analytics in the sidebar. Grigora Analytics opens automatically and displays your website's performance data.
Step 2: Select a Date Range
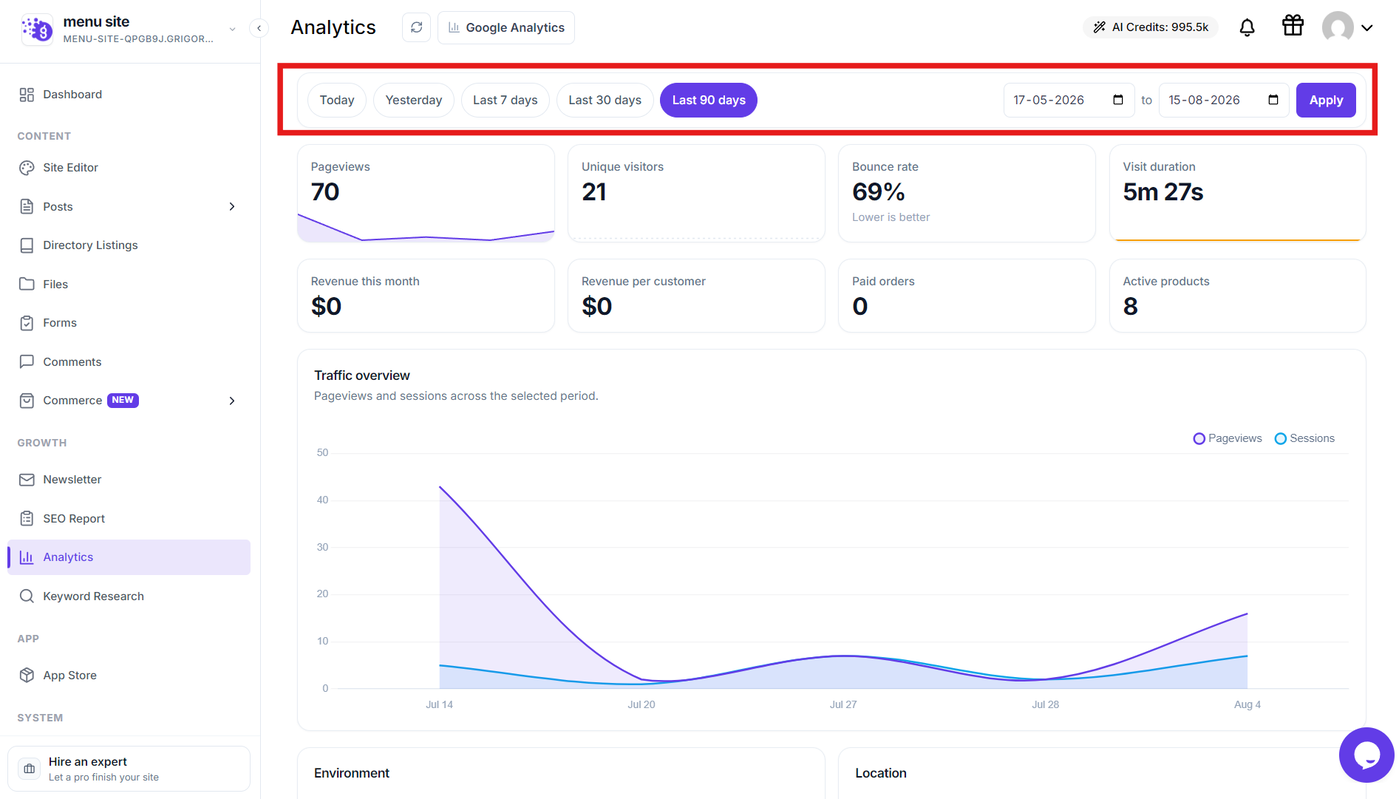
Use the date range options at the top of the Analytics page to view data for a specific period. You can choose from preset ranges such as:
Today
Yesterday
Last 7 days
Last 30 days
Last 90 days
You can also select a custom date range and click Apply.
Review Key Performance Metrics
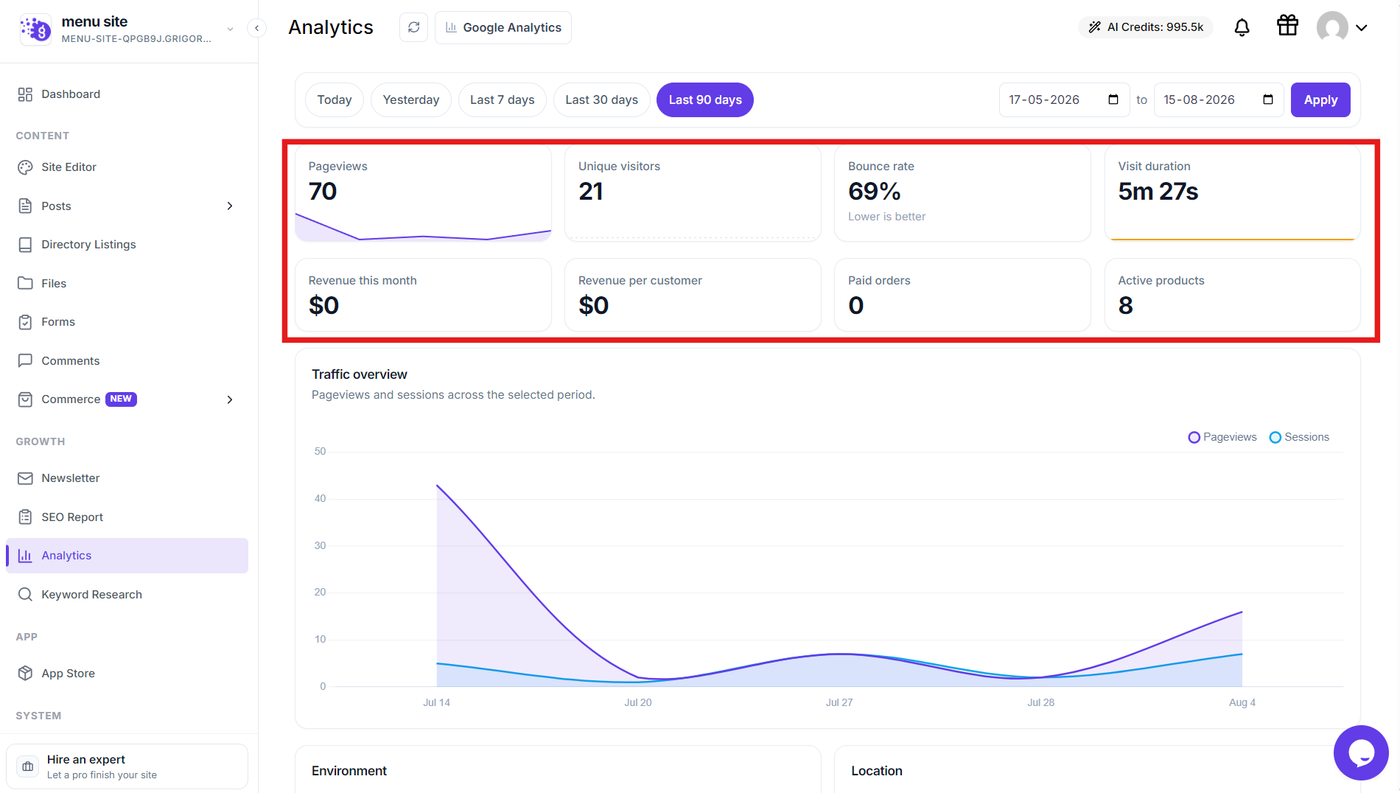
The summary cards provide an overview of your website's performance for the selected period.
You can review:
Pageviews — Total number of pages viewed.
Unique visitors — Number of individual visitors.
Bounce rate — Percentage of visitors who leave without further interaction.
Visit duration — Average time visitors spend on your website.
Revenue this month — Revenue generated during the current month.
Revenue per customer — Average revenue generated per customer.
Paid orders — Number of paid orders.
Active products — Number of currently active products.
Analyze Traffic and Visitor Data
Traffic Overview
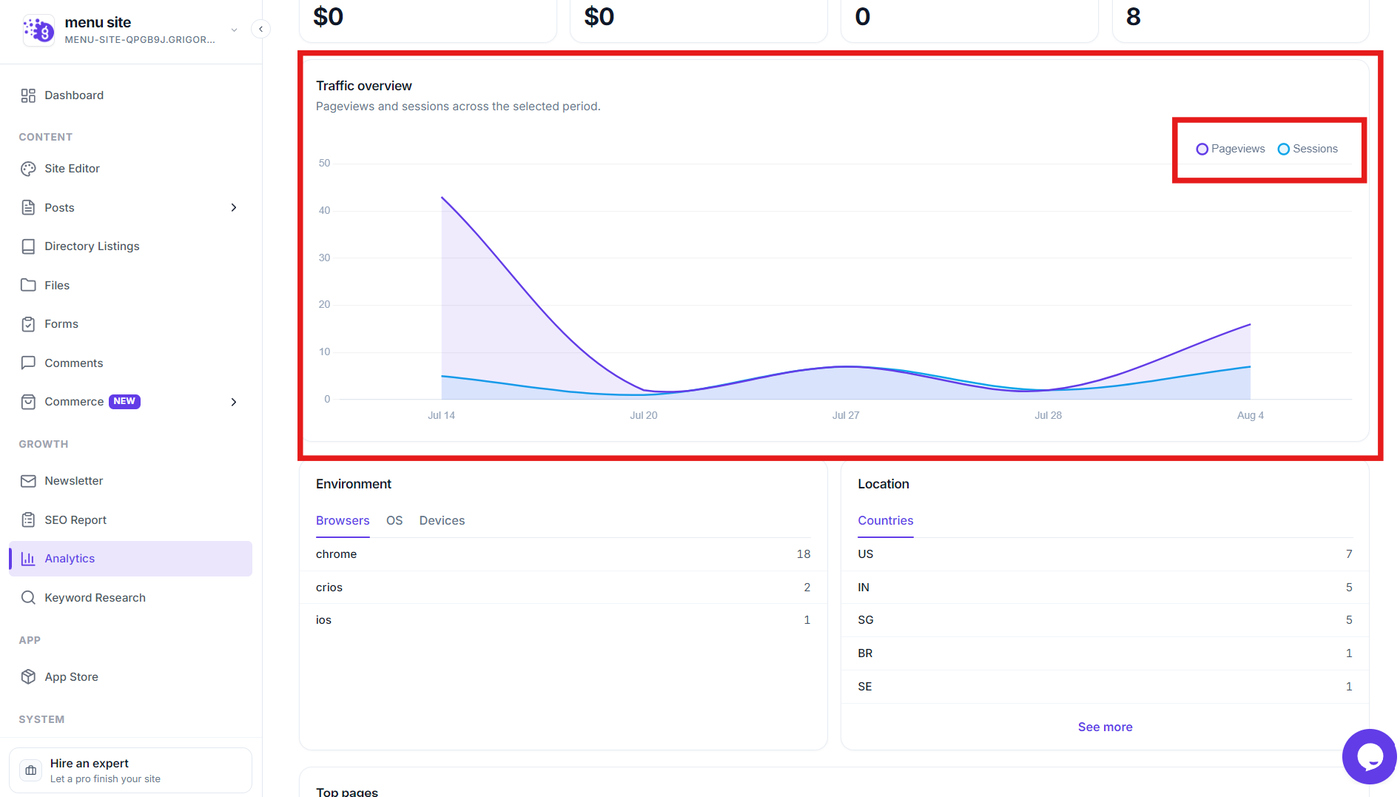
The Traffic overview chart shows pageviews and sessions across the selected date range. Use it to identify traffic patterns and changes in website activity over time.
Environment
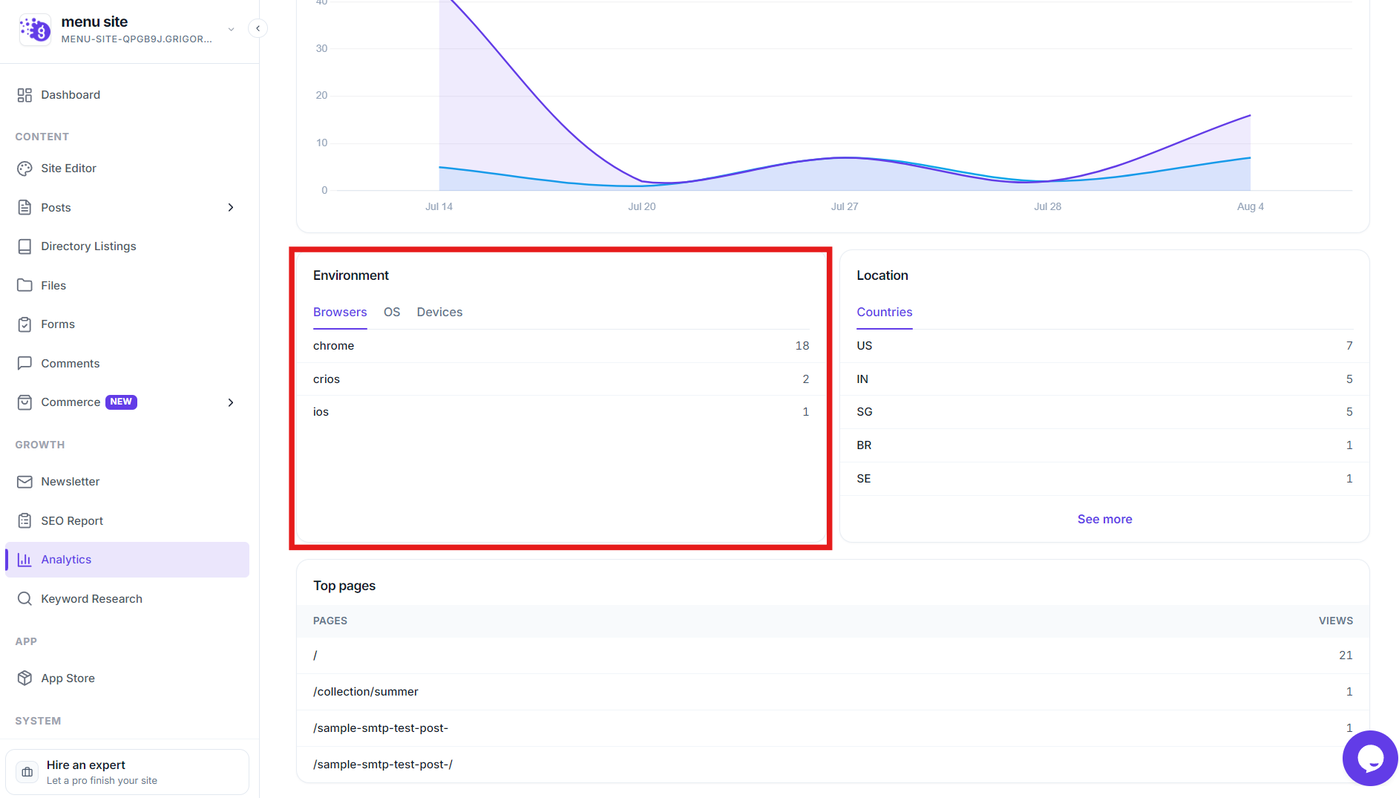
The Environment section shows which browsers, operating systems, and device types visitors use to access your website.
Switch between:
Browsers
OS
Devices
This can help you understand how visitors access your site and identify platforms that may require additional optimization.
Location
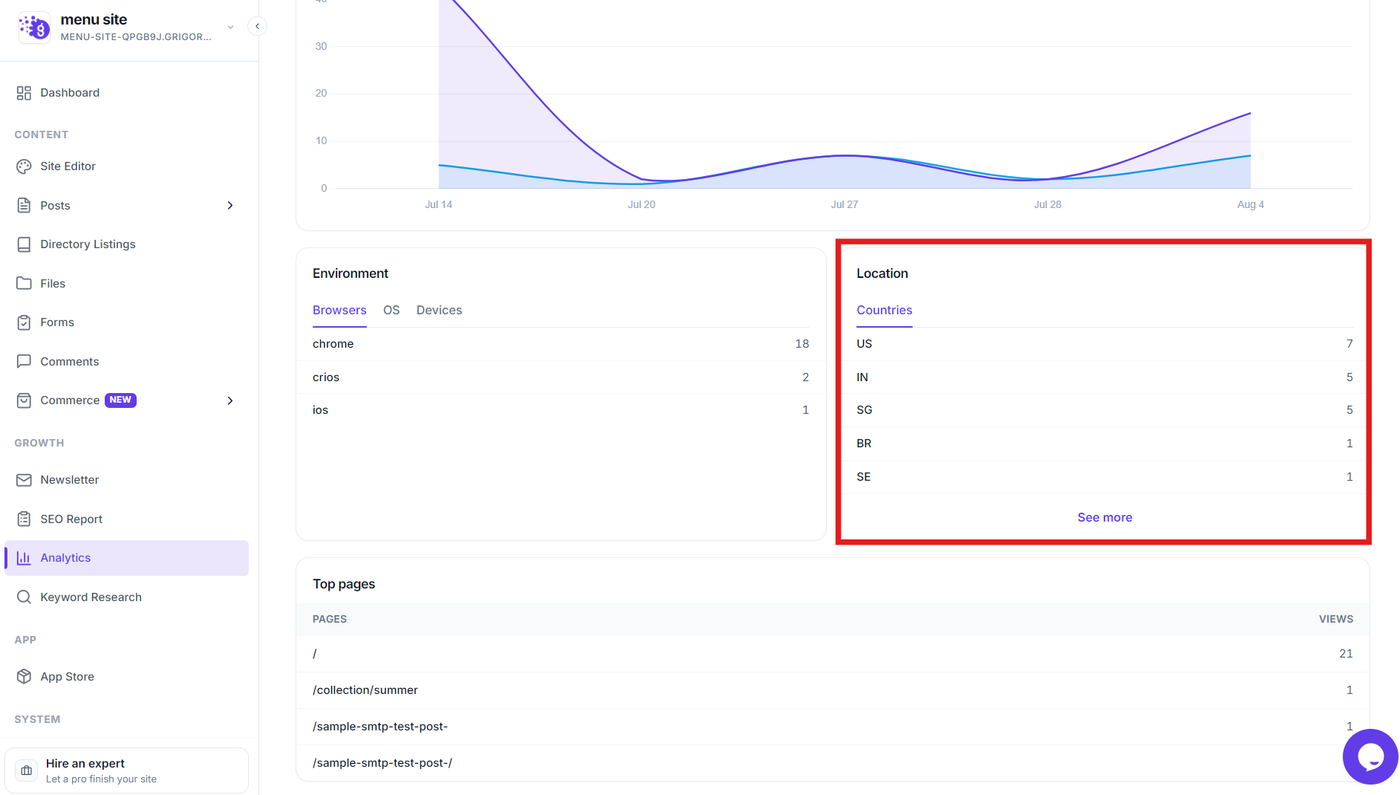
The Location section shows where your visitors are coming from by country. Click See more to view additional countries when more locations are available.
Top Pages
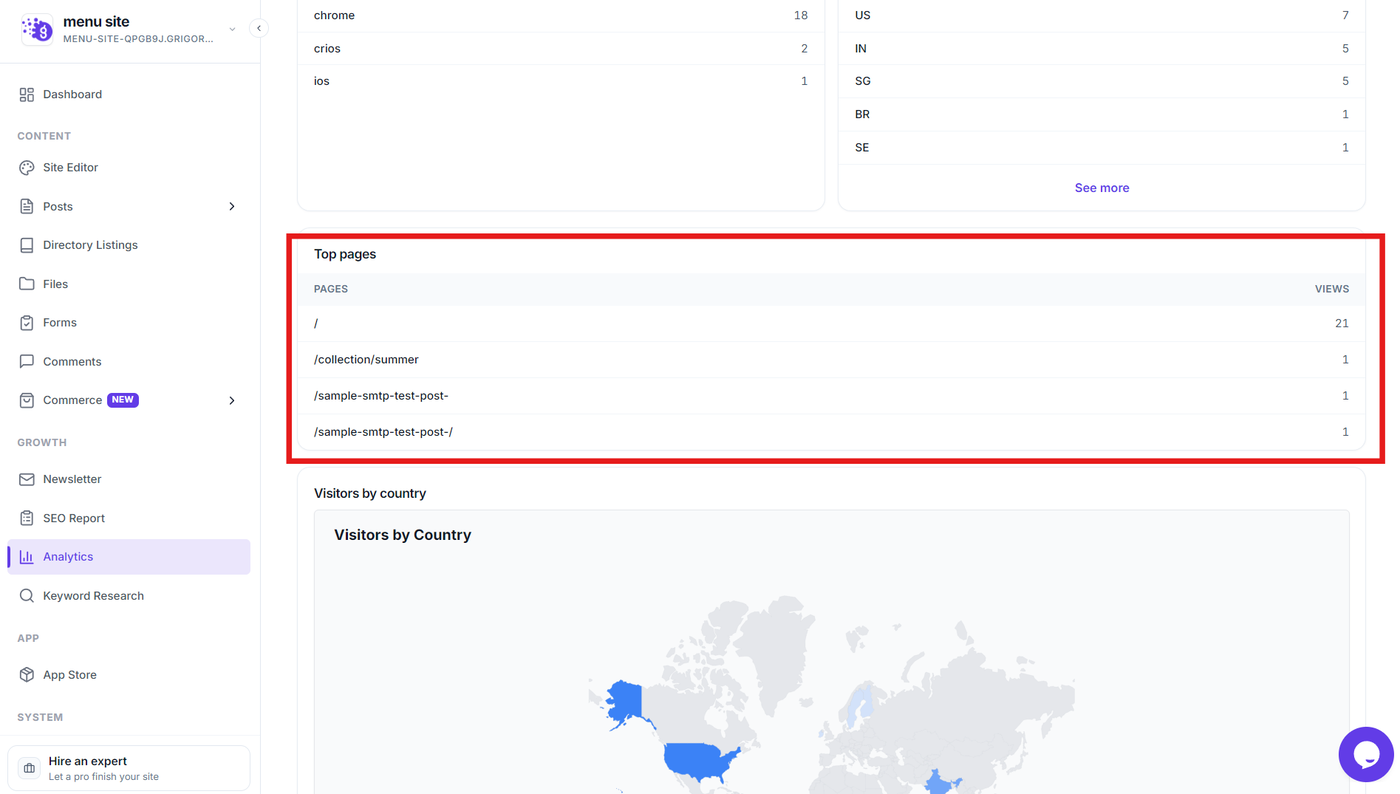
The Top pages section lists the pages receiving the most views during the selected period, along with their view counts.
Use this information to identify your most visited pages and understand which content attracts the most traffic.
Visitors by Country
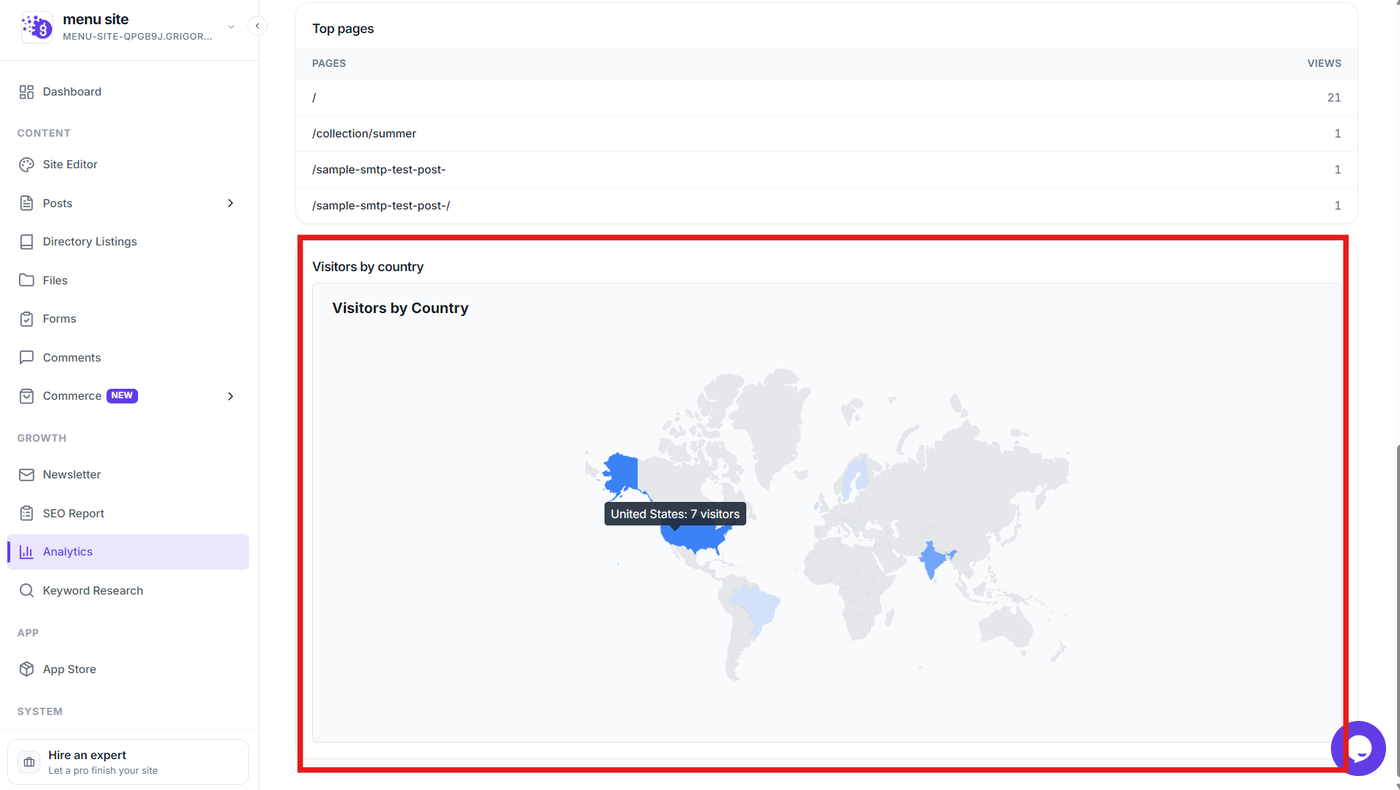
The Visitors by Country map provides a visual representation of where your visitors are located. Hover over a country to view its visitor count.
View Google Analytics
If you prefer to use your connected Google Analytics data, click Google Analytics at the top of the Analytics page.
This switches the dashboard from Grigora Analytics to your connected Google Analytics reports, where you can view metrics such as visitor activity, traffic sources, and page performance. (Grigora)
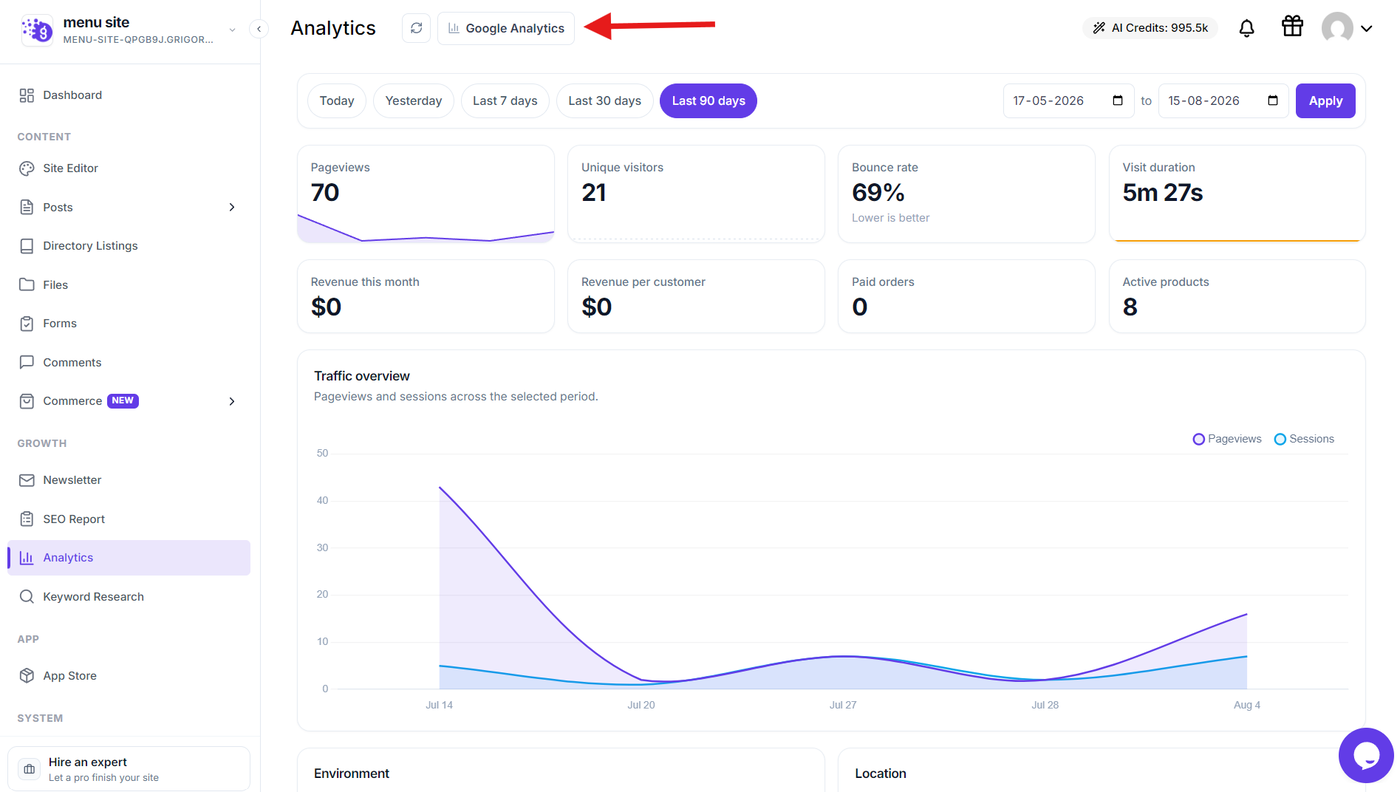
Note: Grigora Analytics is available automatically from the Analytics section. Google Analytics is optional and is available when you have connected a Google Analytics account to your Grigora project. (Grigora)